The goal of this article is to help the reader understand yield curve inversion and the significance of yield curve inversion. We will review the last eight inversions so the reader can appreciate the importance of this recessionary indicator.
What is Yield Curve Inversion?
Yield curve inversion happens when short term interest rates are higher than long term interest rates. During ordinary economic conditions, we expect to earn a premium when committing our capital for a longer time period. Under normal economic circumstances, the yield curve is positively sloped with the lowest rates paid to investors who invest for short periods such as three months and the highest rates paid to investors who invest for thirty years. But during periods of economic uncertainty the yield curve inverts. Instead of receiving the highest interest rate for a long-term commitment, we receive the highest interest rate for the shortest investment term.
Historically, yield curve inversions have not lasted long. The average time from when the inversion begins to when a recession starts is 17 months for the last eight recessions. Generally, once the recession hits, the yield curve returns to a positive slope and the inversion disappears.
Why Does it Matter?
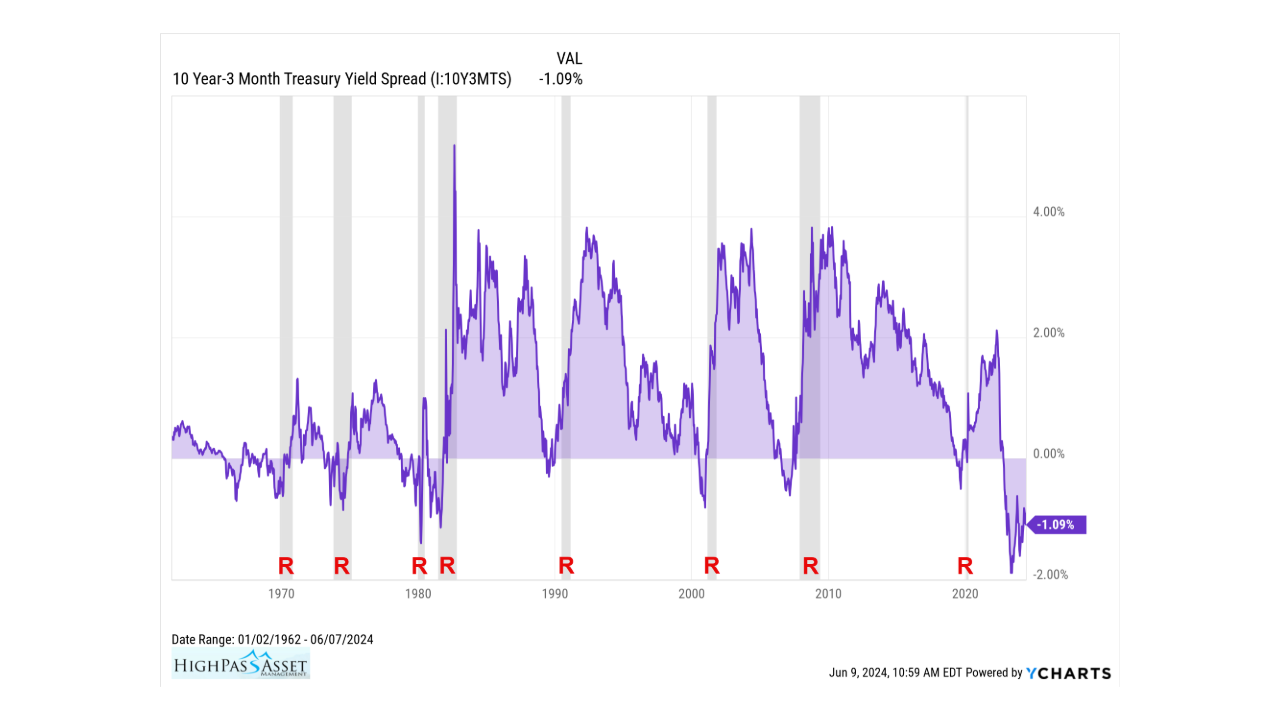
Yield curve inversion is the most accurate indicator of a recession. Each of the last eight recessions has been preceded by an inverted yield curve.

In the chart above, recessions are noted with a red ‘R’ and shaded in grey. Investigating the chart, we can see a clear pattern emerged over the last sixty plus years; yield curve inversion has happened before every single recession.
AVERAGE TIME BETWEEN INVERSION AND RECESSION
The average time from when the inversion begins to when the recession hits is 17 months. This calculation includes the outlier inversion from 1966 – 1970. If we remove that outlier from the data set, the average inversion of the last seven recessions is 13 months.
Here is a close look at the past inversions so we can see the average time for each inversion, prior to the recession.

I remember the 2006 inversion vividly. Investors were initially concerned when the inversion first happened in 2006 and then as time wore on and no recession appeared, investors become complacent. When the recession finally hit many people were caught off guard. The warning sign had been there all along, but many people chose to ignore the indicator; like what is happening with the current inversion in 2024.

The 2000 inversion happened early in my career. I recall most of the analysts at the large banks brushing off the inversion and telling investors that tech stocks were preparing to rip higher…they were wrong.

I find the 2020 government induced recession to be very interesting when you see that the yield curve did in fact invert a full ten months before the COVID recession hit.
Here are some more charts that show the time from the start of the inversion to the beginning of the recession.


As of June 2024, we are 19+ months into the current inversion. Will this time be any different?
Ethan S. Braid, CFA
President
HighPass Asset Management
Denver, CO

