
The 60/40 equity-to-fixed-income asset allocation retirement portfolio is a great asset allocation strategy used by many retirees. Contrary to what some people think, this asset allocation strategy is still relevant and a perfect investment plan for some retirees.
Pros of the 60/40 Retirement Portfolio:
- Protection from Bad Retirement Timing
- Works Well with the 4% Rule
- Higher Cash Flow
- Less Volatility
- Retirees are More Likely to Stay Invested in 60/40 during a Market Crash
Cons of the 60/40 Retirement Portfolio:
- Higher Taxes
- Lower Long-Term Returns
Protection from Bad Retirement Timing
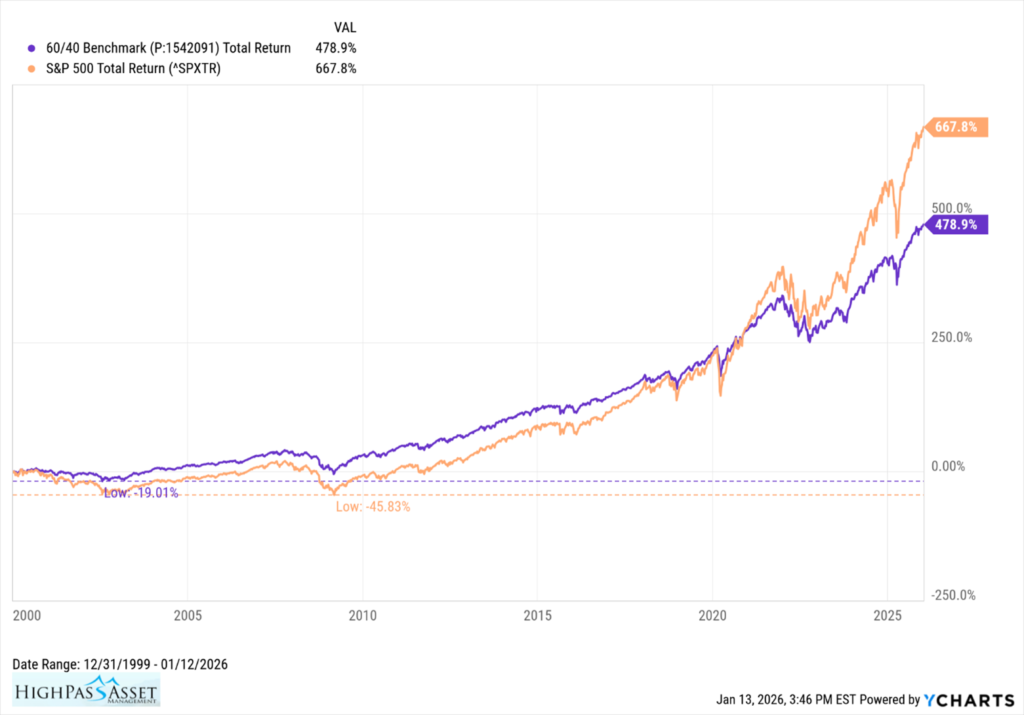
If you have bad retirement timing and retire right before a recession, the 60/40 asset allocation retirement portfolio may provide better wealth protection than an all-equity portfolio. The chart below compares the 60/40 retirement portfolio annually rebalanced retirement portfolio to S&P 500. Both investments are charted for total return. The 60/40 asset allocation retirement portfolio is comprised of 60% S&P 500 and 40% Bloomberg US Aggregate Bond Index.
The starting point of January 1st, 2000, was selected to demonstrate what bad retirement timing looks like, retiring right before a recession and multi-year stock market crash.
Several items should stand out to investors:
- 60/40 asset allocation retirement portfolio hit a low of -19.01%.
- S&P 500 hit a low of -45.83%.
- 60/40 asset allocation retirement portfolio outperformed the S&P 500 for twenty years.
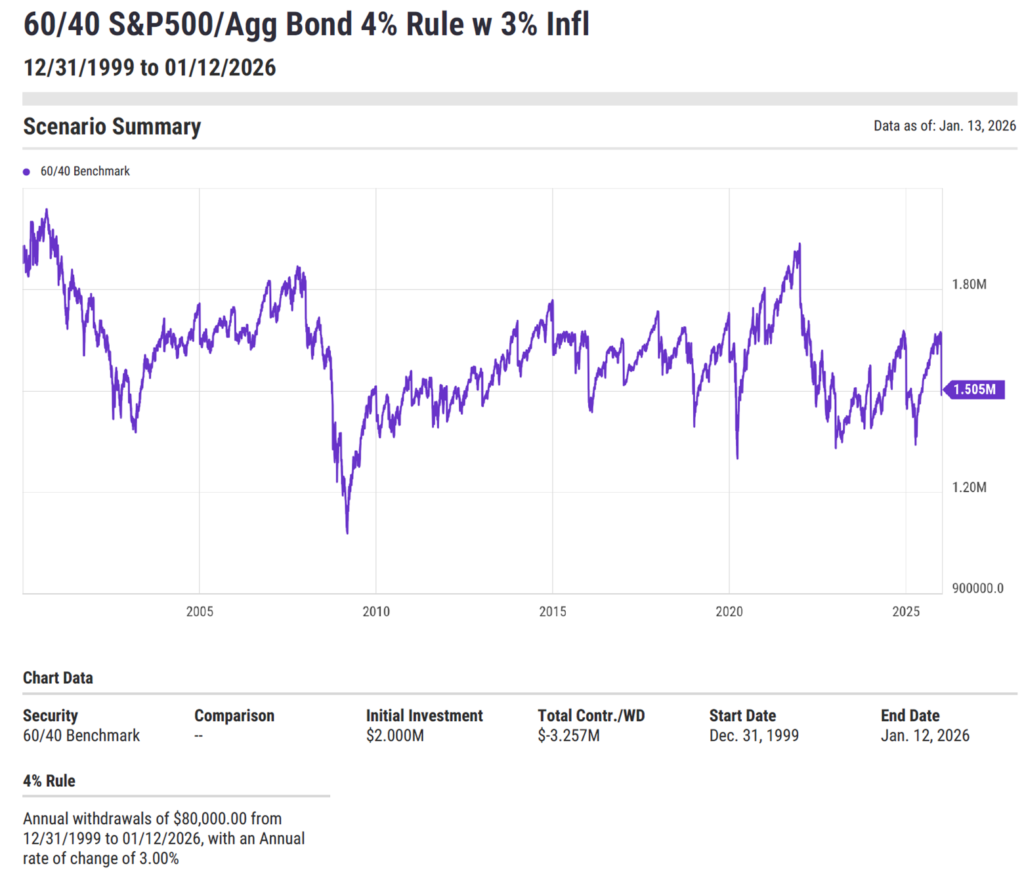
60/40 Asset Allocation Retirement Portfolio Works Well With 4% Rule
The 60/40 asset allocation retirement portfolio coupled with the 4% rule in retirement has high odds of success. The illustration below demonstrates the effectiveness of the 60/40 retirement portfolio coupled with the 4% rule. The illustration is for a $2 million dollar retirement portfolio invested on January 1, 2000. The portfolio is 60% S&P 500 and 40% Aggregate Bond Index. No fees or taxes are paid. The portfolio is rebalanced annually. Four percent, $80,000, is distributed in the first year. Every year thereafter the annual distribution is raised by 3% for inflation.
This period was selected to see how the 60/40 asset allocation retirement portfolio held up under stressful market conditions and bad retirement timing. The portfolio endured the decline in the stock market from 2000 – 2002, the 2001 recession, the 2008 recession and the 2022 bond bear market. After 26 years, the portfolio ended with a valuation of $1.5 million.
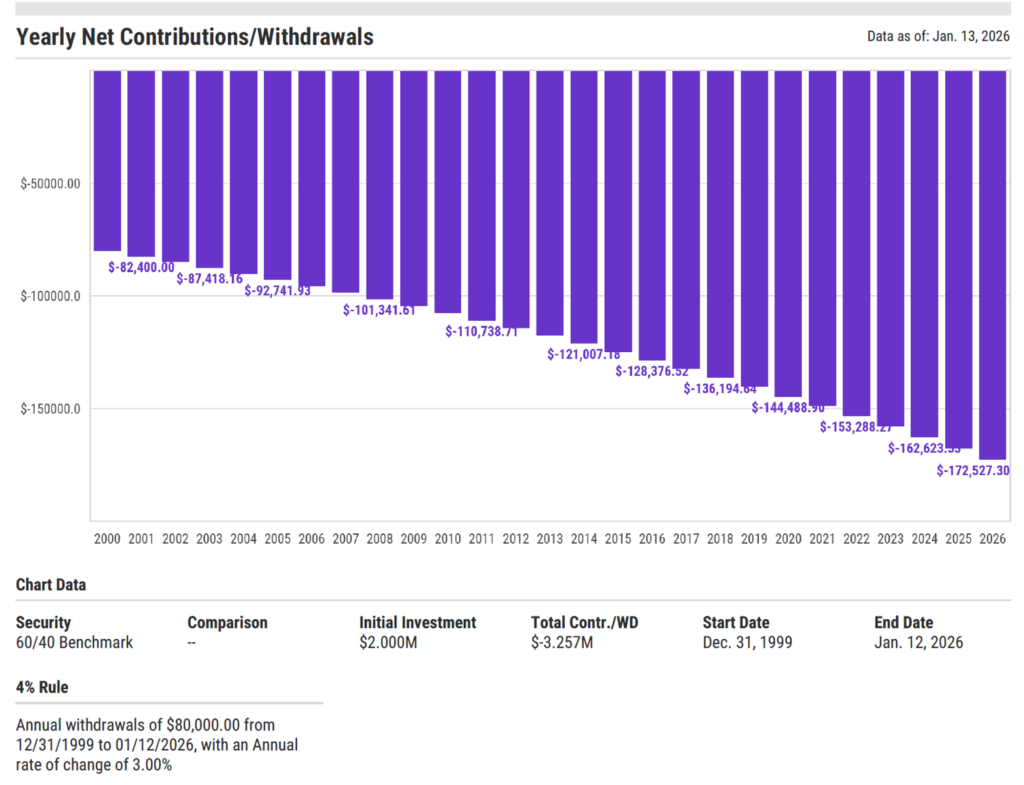
Here is the distribution pattern for the previous illustration.
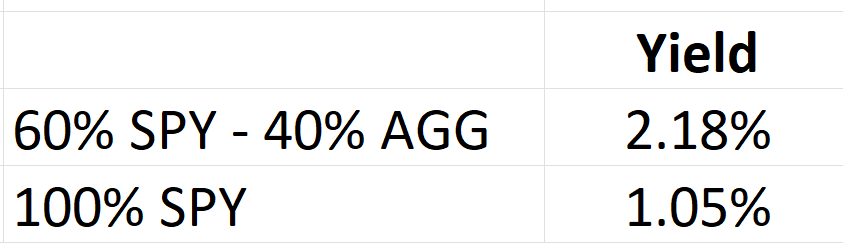
Higher Cash Flow
As of January 12, 2026, the dividend yield on a 60/40 asset allocation retirement portfolio consisting of 60% SPY ETF and 40% AGG ETF was 2.18%.
This yield is double the current dividend yield on the S&P 500 ETF, SPY.
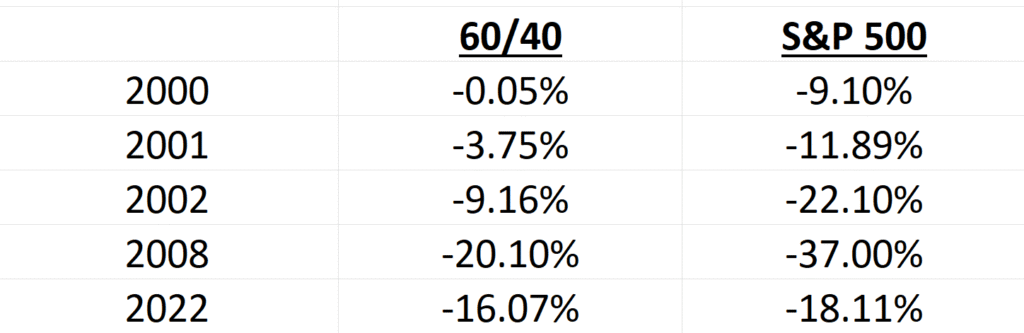
Less Volatility
The 60/40 retirement portfolio has less volatility than the S&P 500. The table below shows the losses for the 60/40 retirement portfolio vs the S&P 500 for all negative years since 2000. The 60/40 asset allocation retirement portfolio numbers are calculated from 60% S&P 500, 40% Bloomberg US Aggregate Bond Index. Returns for the 60/40 retirement portfolio and the S&P 500 are total returns with dividends reinvested. Source – Ycharts.
In the last five negative years for the stock market, the 60/40 asset allocation retirement portfolio lost less than the S&P 500.
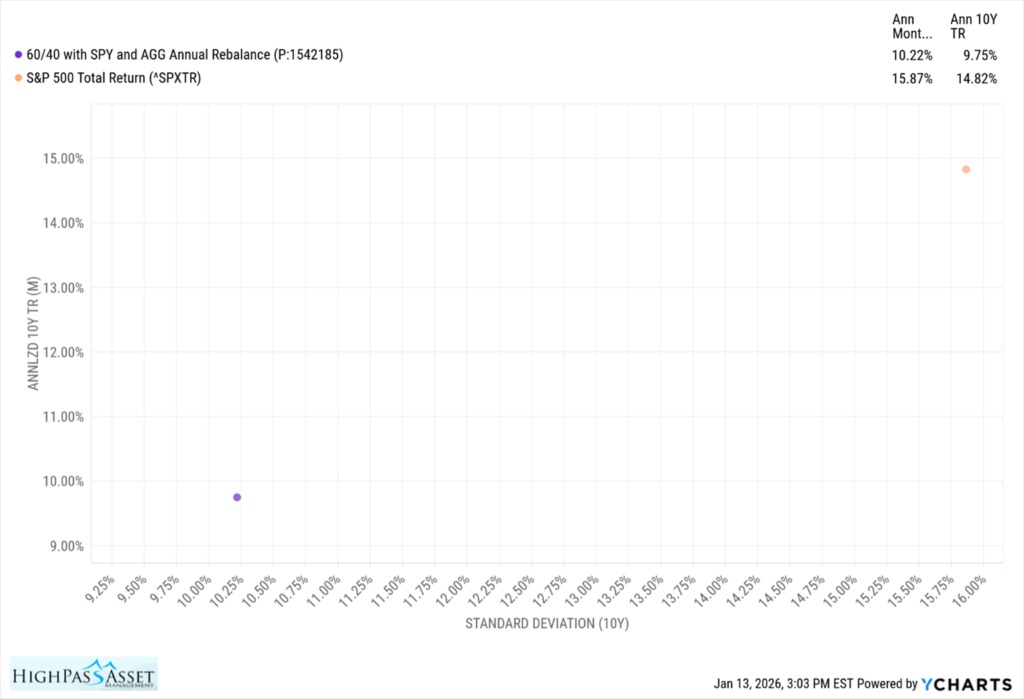
The scatter plot below shows the standard deviation and annualized returns for the 60/40 asset allocation retirement portfolio vs the S&P 500. The scatter plot was built using ten years of returns for S&P 500 ETF, SPY and the US Aggregate Bond Index ETF, AGG. The 60/40 asset allocation retirement portfolio was annually rebalanced and no fees or taxes were applied.
The 60/40 asset allocation retirement portfolio shows significantly less volatility than the S&P 500 over the ten-year period. Retirees should study this chart. Are you comfortable taking fifty percent more volatility with the S&P 500 in an attempt to earn higher returns?
Retirees are More Likely to Stay Invested During a Crash
Market timing can ruin a retirement. The better approach to managing retirement investments is to stay invested and avoid the urge to sell when the market drops. Unfortunately, in every recession, some percentage of retirees will panic and sell when the market has had a big loss. I have seen this personally in the recessions of 2001 and 2008. The 60/40 asset allocation retirement portfolio has a history of lower volatility when compared to the S&P 500. Retirees using the 60/40 retirement portfolio may experience less severe losses in a recession and are more likely to stay invested during a major market crash. Staying invested helps a retiree avoid market timing errors and participate in any future rebound.
CONS
Higher Taxes.
Because 40% of your income in the 60/40 asset allocation retirement portfolio will be coming from bonds, you will pay taxes on your bond interest at ordinary income tax rates for both Federal and State. If you purchase treasury bonds, the interest will be taxed at ordinary income tax rates at the Federal level but will be State income tax free. If you purchase municipal bonds, the income can be federally tax free and state income tax free if the bonds are issued in the state, you reside in. Before purchasing municipal bonds, be sure to calculate your taxable equivalent yield which will be based on your income tax bracket.
Lower long-term returns.
In the long run, and by long run I mean ten years or more, the 60/40 asset allocation retirement portfolio is likely to have lower returns than an all-stock market retirement portfolio. There can be exceptions to this. If you retire right before a recession, the 60/40 asset allocation retirement portfolio could outperform the stock market for a long time, as long as twenty years. But eventually, given enough time, you should expect a 60/40 asset allocation retirement portfolio to underperform an all-stock portfolio.
Ethan S. Braid, CFA
President
HighPass Asset Management
Denver, Colorado
This article is for education and illustrative purposes and is not tax, legal or financial advice. Your broker or advisor will charge you fees or commissions to make investments and therefore your returns will be less than indexes. For example, if you invest in the S&P 500 ETF, SPY, you will pay a fee to the company managing the ETF, State Street Global Advisors. Your return on the S&P 500 ETF, SPY, will be less than the SS&P 500 Index TR because of the fee paid to State Street Global Advisors. Additionally, you may pay a fee or a commission to your broker or financial advisor, further reducing your return, below the index. Consult your advisor or broker for a detailed list of their fees or commissions before you invest. Investing involves risk and you can lose money.