
Choosing an asset allocation is a key decision in any retirement plan. With over 25 years of experience as a financial advisor, I have found that many retirees do not know how much they can make or lose with different asset allocations. The focus of this article will be to provide some risk and return perspective on three common retirement asset allocations using just the S&P 500 total return index and the Bloomberg US Aggregate Bond total return index. To demonstrate what might happen when you go beyond stocks and bonds, I have included the risk and return data for a portfolio that includes commodities and real estate. Commodity returns were calculated with the Bloomberg Commodity PR index and real estate returns were calculated using the DJ US Real Estate total return index.
A person retiring today might expect to be in retirement for 25 – 30 years. For our analysis, to simulate a retirement, I have calculated returns for the 30-year period from January 1st of 1995 to December 31st of 2024. The impact of fees or taxes was not considered. All portfolios were rebalanced annually.
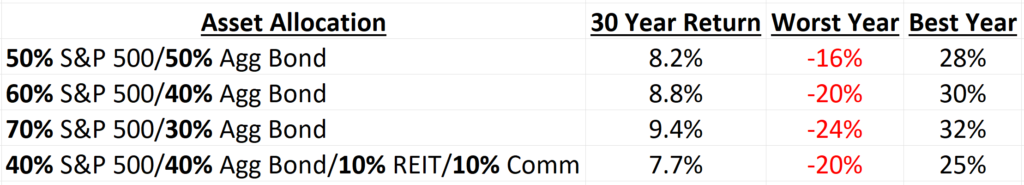
Analyzing the table above can help retirees determine how aggressive they want to be with their asset allocation. Keep in mind that the worst year and best year returns are for calendar years. If you are retired and get hit with a sequence of negative returns event, i.e. two or more negative return years in a row, it is possible that you might see losses that exceed the worst year.
The losses in the worst year column are 2+ standard deviation losses which occurred in 2008. Ninety-seven percent of the time we would expect these asset allocations to provide returns better than the worst year numbers and only three percent of the time we would expect to lose more than the worst year column.
While the future is uncertain and past results are not a guarantee of the future, the past results can give us great insight into potential future gains and losses. Analyzing past losses for a diversified portfolio is a great way to assess your risk tolerance. For example, if you wanted to attempt to limit your losses in any one calendar year to -20% then from the table above your stock market exposure should be limited to 60% S&P 500.
Over-diversifying may protect you in a serious downturn but could cost you money in the long run. A portfolio that is over-diversified may have lower returns. Our research shows that when real estate and commodities were included in the asset allocation, returns were lowered. Comparing the 60/40 to the 40/10/10 you can see that these two portfolios had the same loss of -20% in 2008 but long-term returns were 1.10% less for the portfolio that included real estate and commodities. When building your retirement asset allocation, try to find the optimal balance between the opportunity for returns and protection from a crash in the markets.
Ethan S. Braid, CFA
President
HighPass Asset Management
Denver, CO
Your broker or advisor will charge you fees or commissions to make investments and therefore your returns will be less than indexes. For example, if you invest in the S&P 500 ETF, SPY, you will pay a fee to the company managing the ETF, State Street Global Advisors. Your return on the S&P 500 ETF, SPY, will be less than the S&P 500 Index TR because of the fee paid to State Street Global Advisors. Additionally, you may pay a fee or commission to your broker or financial advisor, further reducing your return, below the index. Consult your advisor or broker for a detailed list of their fees or commissions before you invest. Investing involves risk and you can lose money.