
Stocks have been in a bull market for sixteen years. Many investors have forgotten what it is like to experience a recession. The current environment reminds me a lot of the year 2000. By the year 2000, the stock market had been in a bull market for eighteen years. During that nearly two-decade-long bull market, many investors became complacent, and by the year 2000, they were seeking more risk instead of backing away from risk. Such is the case now. Few investors seem to be fearful. Many are seeking risk, expecting high rewards. I think most are unaware of just how much they can lose if we were to have a recession.
To help investors appreciate just how much they can lose with various asset allocation strategies, I have produced the research in the tables below. The first table shows just how much an investor would have lost had they been invested in a simple portfolio that was made up of the S&P 500 and the aggregate bond market. For my analysis, I used the SPY ETF as a proxy for the S&P 500 and the AGG ETF as a proxy for the bond market. These two ETFs have been around for a long time, so we have access to lots of historical data, which can be helpful.
Determine Your Risk Tolerance
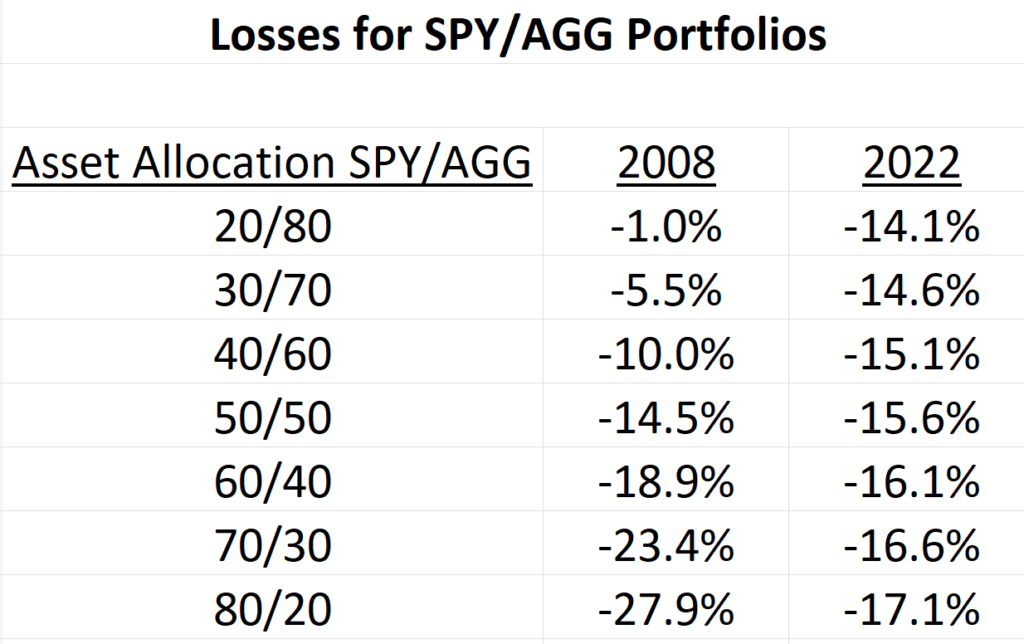
In the data above, we are simply looking at calendar year losses. The 2008 recession was a serious recession and is a good way to gauge a worst-case scenario for your portfolio. Keep in mind that we are looking at a calendar year loss; the peak-to-trough loss for the 2008 recession was slightly more because the selling period was longer than one year.
The table above can help you understand your risk tolerance. If you have a 70/30 equity/fixed asset allocation, for example, you can see that the 70/30 portfolio lost over -23% in 2008. Could you handle that type of loss with your investments now? If the answer is no, then you should not be in the 70/30 asset allocation and should be in a lower risk portfolio.
Future Potential Range of Returns for Seven Different Asset Allocations.
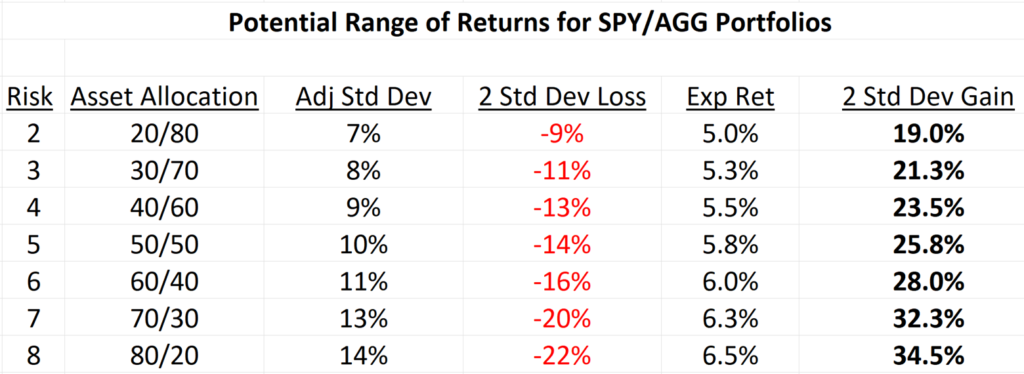
Most financial planners and financial planning software will assign you to a portfolio based on your risk score. In the example above, if you chose a risk score of 7, you would be assigned to a 70/30 equity/fixed portfolio. Going forward, my expectation is that 97% of the time, your worst-case calendar year loss in a 70/30 asset allocation would be -20%. A loss of -20% corresponds to a two-standard-deviation drop for the 70/30 portfolio. About 3% of the time, or 3 years out of 100, you might see calendar year losses greater than -20% for a 70/30 portfolio.
If a loss of -20% is more than you can tolerate, then you need to choose a lower risk score. The best time to reassess your risk tolerance is when stocks are doing well. Now is the perfect time to update how you feel about your investments and make sure you are comfortable with your asset allocation strategy. If you know what to expect the next time markets sell off, then you are more likely to stay invested. Staying invested is the key to long-term success with investing.
Ethan S. Braid, CFA
President
HighPass Asset Management
Denver, CO
Your broker or advisor will charge you fees or commissions to make investments, and therefore, your returns will be less than the indexes. For example, if you invest in the S&P 500 ETF, SPY, you will pay a fee to the company managing the ETF, State Street Global Advisors. Your return on the S&P 500 ETF, SPY, will be less than the S&P 500 Index TR because of the fee paid to State Street Global Advisors. Additionally, you may pay a fee or commission to your broker or financial advisor, further reducing your return below the index. Consult your advisor or broker for a detailed list of their fees or commissions before you invest. Investing involves risk, and you can lose money.